Definition
A wide complex
tachycardia (WCT) is defined as a cardiac rhythm with a rate of ≥ 100 bpm
and QRS
width/duration ≥120 ms or 0.12 sec. Other acronym used is WQRST.
If
you read articles and journals, electrocardiographers will describe a WCT as
right bundle branch block (RBBB) - like configuration or left bundle branch
block (LBBB)-like configuration.
A RBBB is
recognized by a QRS
duration ≥ 120 ms with a predominantly positive portion in V1
(Figure 1A). LBBB
has QRS duration
of ≥120 ms with a predominantly negative terminal portion in V1
(Figure 1B).

Figure 1 – A. RBBB configuration in V1. B.
LBBB configuration in V1.
A Wide Complex Tachycardia (WCT) can be:
- Ventricular Tachycardia (VT)
- Supraventricular tachycardia (SVT):
- with aberrancy in the His-Purkinje system
- with anterograde accessory pathway conduction
- with bizarre baseline QRS
- in presence of drug effect or electrolyte imbalance
- Ventricular pacing
- Electrocardiogram artifact
Providers
in cardiac telemetry are faced with the daunting task of identifying whether a
WCT is ventricular tachycardia (VT) or SVT with aberrancy. Ventricular tachycardia is a tachycardia requiring the
participation of structures below the bundle of His.
Supraventricular tachycardia (SVT) is a
tachycardia requiring the participation of structures
above the bundle of His.

Figure 2 – Diagram Diving Supraventricular
Tachycardia and Ventricular Tachycardia
A narrow QRS
complex is the considered normal and it requires highly synchronous activation
of the ventricles which is made possible though the rapidly conducting His-Purkinje
system (HPS).
The term aberrancy (aberration or aberrant intraventricular
conduction) is used to describe transient bundle branch
block (BBB) and does not include QRS abnormalities caused by preexisting
BBB, preexcitation, or the effects of drugs/electrolyte. The mechanism of
aberration can occur anywhere in the His-Purkinje system (red box in Figure 3).
The transient BBB is due to impulse transmission of a
supraventricular beat during period of physiologic refractoriness and/or depressed conductivity. The
supraventricular electrical impulse is conducted abnormally through the
ventricular conducting system. This results in a wide QRS complex that may be
confused with a ventricular ectopic beat or PVC or VT.
Technicians
often used other terms instead of aberrancy like bundle-switch, intermittent
bundle, conduction change and intermittent ventricular conduction delay.
However, the appropriate term should be aberrancy or aberrant intraventricular
conduction.

Figure 3 - Cardiac Conduction System
Diagnosis by Statistics
The
pretest probability that a WCT is VT is 80%. This means that 4 out 5 WCT is VT.
If patients are known to have prior myocardial infarction and the symptom of
tachycardia occurred after the probability increases to > 90%.
The Purpose for a Correct Diagnosis
The
purpose of arriving at the correct diagnosis is to avoid harm to the patient.
If SVT is treated as VT and given amiodarone or electrical cardioversion (which
may not be harmful) it is not the optimal therapy. If it was atrial flutter,
cardioversion will entail a risk of stroke.
If VT is treated as SVT (using diltiazem/verapamil), hemodynamic
deterioration may occur. If SVT are managed as VT, they might be placed on
long-term amiodarone which carries a number of long-term problems or an
implantable defibrillator with repeated generator change. However, hunting the
diagnosis is second only to stability of the patient. If the patient is
unstable then immediate cardioversion and then once stable the various
morphological characteristics and algorithms are used - – (Garner J and Miller J. 2013. Wide Complex Tachycardia
– Ventricular Tachycardia or Not Ventricular Tachycardia,That Remains the
Question. Arrhythmia &
Electrophysiology Review 2013;2(1):23–29)
Algorithms Focus on VT Characteristics
Most algorithms
differentiating VT from SVT with aberrancy focus on characteristics unique to VT. If those characteristics are not present, then it is presumed
SVT until proven. We should also recognize that algorithms find
it hard to distinguish VT from pre-excited SVT.
The
algorithms developed utilize the 12 lead ECG. However, in this age of ECG
telemetry, most wide QRS tachycardia are captured and saved in central
telemetry which can view all the limb leads and a V1 +/- V6.
 |
Figure 4 – Typical Central Telemetry Set-up
ECG Criteria/Features in Cardiac
Telemetry Supporting VT
·
Fusion
Beat
·
Capture
Beat
·
V1 and
V6 Morphology
·
aVR
algorithm (Vereckie algorithm)
· “K. Wang Logic”
AV dissociation
During
VT, there is independent beating of the atria and
ventricles. In patients with underlying sinus rhythm, the atria are
depolarized by an impulse coming from the sinoatrial (SA) node while the ventricles
are controlled by an ectopic ventricular beat. The atrial rate is slower
compared to the ventricular rate. AV dissociation is difficult to spot but not
impossible. AV dissociation is easier to see in slower VT but difficult
to appreciate during fast rates. Multiple simultaneous leads are needed to
compare distortions and determine if those distortions are indeed P waves.
Look
for AV dissociation in the case below. Map the P waves and the QRS.

Figure 5 – WCT case
for AV dissociation

Figure 6 – P waves
marked with arrows
The
P to P interval is 18 small boxes (cycle length 720 ms) or an atrial rate of
about 83 bpm. The R to R interval is 14
small boxes (cycle length 540 ms) or a ventricular are of about 107 bpm. At
that rate difference, we can see dissociation. Another way of visual
recognition is using a ladder diagram. However, this might be time consuming in
the acute setting. For educational purposes the ladder diagram is presented
below. The diagram will show independent beating of the atria and ventricles or
AV dissociation.

Figure
7 – Ladder diagram showing AV dissociation
Fusion
Beat
The
ventricles may be also be depolarized both by the
ectopic ventricular impulse and a supraventricular impulse resulting in
a QRS complex that is intermediate in morphology between the sinus beat and the
ectopic ventricular beat. This complex is a fusion beat.
The
previous ECG case featuring AV dissociation will be used. In the strip below, the
morphology of R4, R10 and R16 is different compared to the rest of the R waves.
The duration of these 3 R waves is about 0.12 seconds (vs. 0.16 sec).

Figure 8 – Fusion beats highlighted with
arrows
The
reason for the difference in QRS morphology is because R4, R10 and R16 are
fusion beats. This is best illustrated in the ladder diagram.

Figure 9– Ladder diagram showing fusion
beats
Below
is another example of a fusion beat (red arrows) which supports that the WCT is
VT and not SVT with aberrancy. The first 4 complexes are sinus beats. After the
5th complex is the full duration of the WCT. If you only use leads
II and V1, it will be difficult for you to appreciate the difference in the
shape of complex #5 which is a fusion beat. However, if you use full disclosure
to see all limb leads, you will appreciate that complex #5 is different in
shape from the first 4 complexes and the WCT.

Figure 10 – Fusion beat highlighted by
arrows
Capture
beat
During
slower VT, occasional supraventricular impulse may be
transmitted through the AV node and depolarize the ventricles resulting
in a normal looking QRS (capture beat) in the middle of wide QRS beats.
The interval of a capture beat is shorter than during the
tachycardia or its rate is faster compared to the WCT.
The
complexes below (red box) are captured beat. It has the same morphology or
shape with that of a sinus beat (latter part of the strip). The presence of the
capture beats means that the WCT is VT.

Some
of the telemetry systems have 6 wires. The 4 wires are for the limbs and the
other 2 wires are chest leads. These 2 wires can be positioned in the V1 and V6
position. Thus, the interpretation of an electrocardiographer in WCT diagnosis
is dependent on correct lead positioning.
The
following morphology in V1 and V6 supports VT:
•
RBBB-VT
v
V1 -
Monophasic R, QR, or RsR’ (rabbit ear with right greater than left)
v
V6 – R/S ratio < 1, QR or QS, monophasic R
•
LBBB-VT
v
V1- Initial r > 30 ms, nadir of S > 60 ms,
notched downstroke
v
V6 – any q, QS or QR
These
features are difficult to remember. So, a cheat sheet is handy in telemetry stations.

Figure 12 – V1 and V6 morphology criteria
for VT (top) and SVT with RBBB morphology (bottom)
(From
Garner J and Miller J. 2013. Wide Complex Tachycardia – Ventricular Tachycardia
or Not Ventricular Tachycardia, That Remains the Question. Arrhythmia & Electrophysiology Review 2013;2(1):23–29)
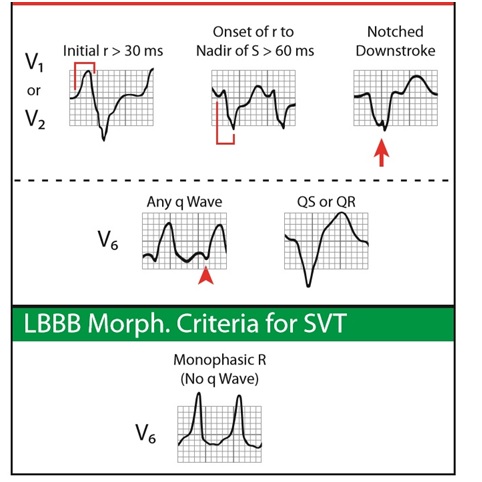
Figure 13 – V1 and V6 morphology for VT (top)
and SVT with LBBB morphology (bottom)
(From Garner J and Miller J. 2013. Wide
Complex Tachycardia – Ventricular Tachycardia or Not Ventricular Tachycardia, That
Remains the Question. Arrhythmia &
Electrophysiology Review 2013;2(1):23–29)
Several
criteria and/or algorithm had been developed through the years.
•
Sandler and Marriot Criteria (1965)
•
Wellen’s Criteria of RBBB (1978)
•
Kindwall criteria of LBBB (1988)
•
Brugada algorithm (1991)
•
Griffith algorithm (1994)
•
Bayesian Analysis (2000)
•
Vereckie Algorithm I (2007)
•
Vereckie
Algorithm II (2008)
•
Pava Criteria of lead II (2010)
A
lot of these used several leads and the famous Brugada criteria utilize a
12-lead ECG. In 2008, the group of Dr. Vereckie used a four-step decision tree
(algorithm) using only aVR. They hypothesized that aVR might be more sensitive
than the other leads in differentiating WCT because, in normal sinus rhythm and
SVT, ventricular activation wavefront proceeds in a direction away from aVR,
typically yielding a QS complex in aVR. Their study showed that the new aVR
algorithm devised for differential diagnosis of wide QRS complex tachycardias have
superior overall test accuracy and greater sensitivity and negative predictive
value in VT diagnosis compared with the Brugada algorithm.
The new Vereckie algorithm is shown below. The algorithm in
a stepwise fashion looks at aVR for (1) an initial R wave, (2) initial r or q
wave > 40 ms, (3) a notch in the descending limb of a predominantly negative
QRS and (4) vi/vt ≤ 1. Vi stands for voltage change in the initial or first
40 ms and vt stands for voltage change in the terminal or last 40 ms. Anything
answered yes in the algorithm is VT.

Figure 14 – The New Vereckie Algorithm

Figure 15 – Morphologic features supporting
VT in the New Vereckie Algorithm (From Garner J and Miller J. 2013. Wide
Complex Tachycardia – Ventricular Tachycardia or Not Ventricular Tachycardia, That
Remains the Question. Arrhythmia &
Electrophysiology Review 2013;2(1):23–29)
“K. Wang Logic”
Dr.
Kyuhyun Wang (Dept. of Medicine - University of Minnesota) is one of the best
electrocardiographer I found in cyberspace and happened to be an internet
acquaintance. He is like following the lines of Dr. Henry Marriott. In 2013, he
published Atlas of Electrocardiography. In there, I found 3 simple logical
reasoning to differentiate VT from SVT with aberrancy in patients in sinus rhythm
which is highly applicable in cardiac telemetry because we can see the
beginning of the WCT. Thus, I am calling it the “K. Wang Logic”.
If the patient in sinus rhythm (SR), it is easy
to identify VT and SVT with aberrancy:
1.
When the run of WCT is preceded by a premature P wave (often the P wave
has a different morphology), then it is SVT with
aberrant conduction.
The ECG case below is from a 75 yr old
patient with pontine infarct with several episodes of wide and narrow complex
tachycardia. The tachycardia starts with a premature atrial complex (red arrow)
with a long PRI. The P wave has a different morphology or shape during that of
sinus rhythm. Following the “K. Wang logic”, this WCT is SVT with aberrancy.
Further examination of the strip, will reveal
inverted P waves (II, III and aVF) right after the R waves (blue arrows). This
indicates retrograde atrial activation. This supports that this SVT most likely
typical AV nodal reentry tachycardia (AVNRT).

Figure 16 – A WCT preceded by a PAC
2.
If the WCT is preceded
by a regularly (not prematurely) occurring
sinus P wave (the PR interval is shorter than
that of normally conducted sinus beats), it is ventricular
tachycardia

Figure 17 – A WCT preceded by a regular sinus P wave with short PRI
3.
If the WCT is not
preceded by a P wave, it is ventricular
tachycardia

Figure 18 – A WCT not preceded by a P wave
Conclusion
The diagnosis of VT has undergone evolution. There is still “no one criterion to end all criteria”. People in front of
telemetry monitors are by default forced to be familiar with all available criteria. However, there will be some
ECG’s that will not “read” books and journals. Thus, if uncertain about the
diagnosis of a WCT, it is wise
to treat it as VT. You will be correct 80% of the time. However, we should
still try to create a logical explanation why a WCT is VT and not just depend
on statistics.
References:
Blomström-Lundqvist
C, Scheinman M, Aliot E, et al. 2003. ACC/AHA/ESC guidelines for the management
of patients with supraventricular arrhythmias∗—executive summary: a report of
the American college of cardiology/American heart association task force on
practice guidelines and the European society of cardiology committee for
practice guidelines (writing committee to develop guidelines for the management
of patients with supraventricular arrhythmias) Developed in Collaboration with
NASPE-Heart Rhythm Society. J Am Coll Cardiol. ;42(8):1493-1531.
Bonnow et al. 2014. Braunwald's Heart
Disease: A Textbook of Cardiovascular Medicine. 10th Edition. PA.Saunders
Brugada
P et al. 1991. A New Approach to the Differential Diagnosis of a Regular
Tachycardia With a Wide QRS Complex Circulation 83:1649-1659 (http://circ.ahajournals.org/content/83/5/1649)
Das
and Zipes. 2012. Electrocardiography of arrhythmias: a comprehensive review.
Elsevier PA
Fisch
C and Knoebel S. 1992 .Vagaries of Aberrancy. Br Heart J 67:16-24
Fisch C and Knoebel SB. 2000. Electrocardiography
of Clinical Arrhythmia. New York. Futura Publishing Co.
Fisch
C. 1983. Aberration: seventy five years after Sir Thomas Lewis. Br Heart J; 50:
297 -302
Fisch
C., Zipes DP and McHenry PL. 1973. Rate Dependent Aberrancy. Circ 48:714-724
Garner
J and Miller J. 2013. Wide Complex Tachycardia – Ventricular Tachycardia or Not
Ventricular Tachycardia,That Remains the Question. Arrhythmia & Electrophysiology Review 2013;2(1):23–29
Goldberger
A. 2013. Goldberger’s Clinical Electrocardiography : A Simplified Approach 8Ed.
Ph Elsevier
Issa
Z, Miller J and Zipes D. 2012. Clinical Arrhythmology and Electrophysiology: A
Comprehensive Review - A Companion to Braunwald’s Heart Disease 2nd Ed. PA
Saunders
Miller
et al. 2006. The Value of 12-Lead ECG in Wide QRS Tachycardia Cardiology
Clinics 24:439-451
Surawicz
B and Knilans TK. 2008. Chou’s Electrocardiography in Clinical Practice. 6th
ed. PA. Saunders-Elseiver
Vereckie A et al. 2008.New algorithm using only lead aVR for differential diagnosis of wide QRS
complex tachycardia. Heart Rhythm ;5:89 –98 (http://lab230.com/files/Miller_Criteria_for_wide_complex_tachycardias-_EHJ.pdf)
Wang
K. 2013. Atlas of Electrocardiography. India. JP Brothers Medical Publishers
No comments:
Post a Comment
Note: Only a member of this blog may post a comment.