A
75yo patient is admitted for dizziness. On telemetry, the rate suddenly
dropped. What is your interpretation?

Figure 1 - ECG case
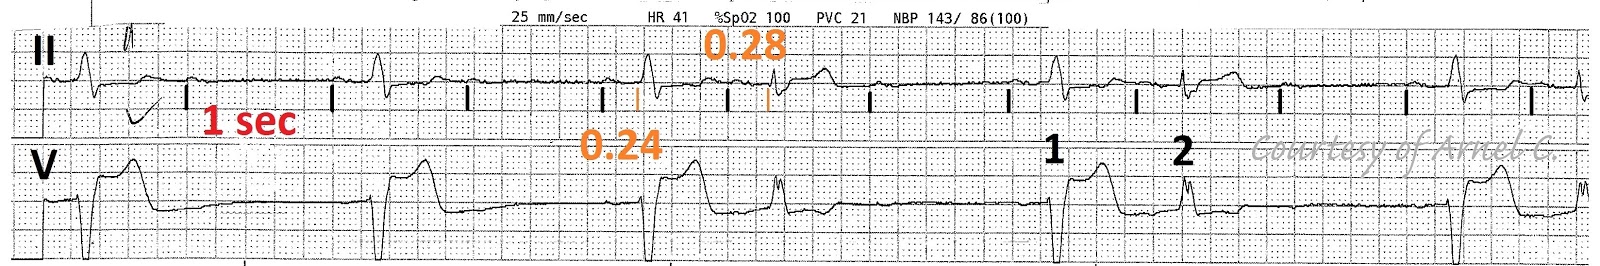
Figure 2 -ECG case marked
The
rhythm is sinus at a rate of about 60 bpm (P waves marked with black lines).
The computer computed ventricular rate is about 41 bpm. The initial few
complexes have a 2:1 conduction with a left bundle branch block (LBBB)
morphology. The latter part has 3:2 conduction with alternating LBBB and right
bundle branch (RBBB) morphology. Examining closely, the LBBB QRS has a PRI of
about 0.24 sec and the RBBB QRS has a PRI of 0.28. So, when asked how to
describe the strip, it should be:
2:1
and 3:2 conduction in the setting of alternating bundle branch block with
changing PRI
A
highly skilled electrocardiographer can grasp what is happening once they hear
this description which we will see later.
A
simplistic interpretation would be
second degree AV block type I because there is PRI prolongation then there is a
non-conducted P wave. The LBBB can possibly be explained by rate-related
aberrancy (bradycardia-dependent). However, there is an "alternative unifying
explanation".
A Unifying Explanation
In
ECG cases that looked bizarre, odd, funky or a WFR (what a f*&*#g rhythm),
there is a single unifying explanation. There is no such thing as WFR. There is
a logical explanation for every rhythm. In this case, the unifying explanation
is a bilateral bundle branch block.
Prolonged PR Interval… not only AV
nodal problem
In
our case, there is a prolonged PRI or first degree AV block. Basic
electrocardiography taught us that the basic problem in first degree AV block is
in the AV node. However, the prolongation in the PRI can be due to conduction delay
in the atrium, AV node, intra-His, infra-His or bundle branches. Lepeschkin
came up with an illustration demonstrating the effects of blocks in the bundle
branches (Figure 3).

Figure 3 – Schematic Representation
of the Effect of Various Degrees of First Degree Bilateral Bundle Branch Block
on the ECG in Lead I
If
you cannot understand it with the first reading, then you are not alone. It
took me several times to grasp the concept. Anyway, the purpose of the
illustration is to show that problems in the bundle branches can prolong the
PRI.
Aside from first degree, second
degree and third degree block can also happen in the bundle branches.
The Ladder Diagram
Proposing
the mechanism for a bilateral bundle block is difficult. For this ECG case, I
created a ladder diagram (Figure 4) of the possible mechanism.

Figure 4 - Ladder Diagram. The right
bundle branch is on the reader's left and the left bundle branch is on the
reader's right. 0 – blocked, + conducted.
In
the bottom of ladder diagram, there is an annotation on the conduction of the bundle
branches. The first 5 beats are blocked in the LEFT BUNDLE BRANCH (marked 0 at
the bottom) and are conducted to the RIGHT BUNDLE BRANCH with a 2:1 pattern. When
there is a LBBB pattern, conduction is through the RIGHT BUNDLE and then
spreads to the LEFT BUNDLE and vice versa. Thus, even though the LEFT BUNDLE
BRANCH is blocked it was still depolarized from the RIGHT BUNDLE BRANCH (little
delayed). This explains the initial 2:1 LBBB pattern.
Later,
there is a 3:2 pattern (LBBB/RBBB/BLOCKED). This is can be due to an
asynchronous 3:1 block in both branches. This is best understood by looking at the
codes at the bottom of the ladder diagram. There is a 3:1 block in the RIGHT
BUNDLE (0 0 +) which means that for every 3 attempted conduction there is only
one is successful beat. The same is true on the LEFT BUNDLE but the occurrence is
not synchronous with the RIGHT BUNDLE. Thus, creating the 3:2 conduction with
alternating bundle branch block.
What Happened Later?
The
patient ventricular rate dropped further and manifested with high-grade AV
block on the surface ECG (Figure 5). The patient was transferred to the ICU and
a pacemaker was eventually inserted.

Figure 5 – High grade AV Block
Alternating Branch Block
According to Dr. Mark Josephson,
"spontaneous alternating bundle branch block, particularly when associated
with a change in P-R interval, represents the most ominous sign for progression
to A-V block. Beat-to-beat alternation is the most ominous, whereas a change in
bundle branch block noted on different days is somewhat less ominous. In either
case, this finding portends the development of A-V block. This phenomenon
implies instability of the His-Purkinje system and a disease process involving
either both bundle branches, the His bundle, or the main trunk".
Take Home Message: Simplistic
Pattern Recognition
It
is difficult to grasp the concept of bilateral branch block but to simplify
things for most of us involved in ECG pattern recognition:
ONCE YOU SEE ALTERNATING BUNDLE
BRANCH BLOCK WITH CHANGING PR INTERVAL, BE PREPARED FOR SOME “EXCITEMENT” OR
THINK OF YOUR PACER PADS. THIS PATTERN SIGNALS POSSIBLE PROGRESSION TO COMPLETE
HEART BLOCK.
Final
Interpretation: Bilateral Bundle Branch Block / alternating bundle branch block
presenting as 2:1, 3:2 conduction
References:
Fisch C and Knoebel SB. 2000.
Electrocardiography of Clinical Arrhythmia. New York. Futura Publishing Co.
Josephson, M. 2008. Clinical Cardiac
Electrophysiology: Techniques and Interpretations, 4th Edition Lippincott
Williams & Wilkins
Lepeschkin E. 1964. The
Electrocardiographic Diagnosis of Bilateral Bundle Branch Block in Relation to
Heart Block. Progress in CV Disease Vol 6 # 5, 445-471
Ranganathan N et al. 1972. His
Bundle Electrogram in Bundle-Branch Block. Circulation XLV
Schloff L et al. 1967. Bilateral
Bundle-Branch Block Clinical and Electrocardiographic Aspects. Circulation Vol
XXXV 790-801
#671
No comments:
Post a Comment
Note: Only a member of this blog may post a comment.